
DATA ON AGING: MYANMAR
Click on a map area or chart line to isolate a single data point. Click anywhere on the background of the graph to return to the original view.
You may share or download individual data visualizations by using the share icon at the bottom of each map or chart.
Suggested citation for maps: AHWIN, “Data on Aging,” www.ahwin.org/data-on-aging; by Hayashi et al., “Demand and Supply of Long-Term Care for the Older Persons in Asia” (ERIA Research Project Report, 2019, updated)
Suggested citation for charts: AHWIN, “Data on Aging,” www.ahwin.org/data-on-aging; compiled based on United Nations, Department of Economic and Social Affairs, Population Division, World Population Prospects: The 2022 Revision, Key Findings and Advance Tables (2022).
Questions or suggestions? Please email [email protected].
Support ratio
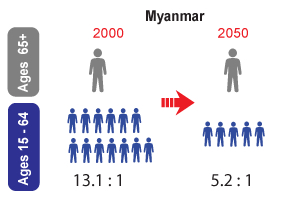
In 2000, there were roughly 13 people aged 15–64 in China for every 1 person 65 years or older.
In 2050, that number is expected to drop to just over 5 people—a decrease of roughly 60%.