Explore Aging by the Numbers

The world population is aging rapidly, but nowhere will that impact be felt as strongly as Asia

Scroll down to explore the story of aging in Asia. Many of the images below are interactive, so hover or click to get more detailed data.

While this page can be viewed on mobile devices, it is optimized for viewing on desktop or tablet devices.

  • Click on an area of the map to isolate a single region. Click anywhere on the background to return to the original view.
  • You may share or download individual data visualizations by using the share icon at the bottom of each map or chart.
  • In all UN data on this site, values for 1950–2022 are estimates and those thereafter are projections (medium variant).
  • Questions or suggestions? Please email [email protected].

The proportion of Asia’s population 65 years and up is rising quickly, but it hasn’t caught up to Europe or North America yet.

  • Click on a line or an entry in the legend to isolate a single region. Click anywhere on the background of the graph to return to the original view.
  • You may share or download individual data visualizations by using the share icon at the bottom of each map or chart.
  • In all UN data on this site, values for 1950–2022 are estimates and those thereafter are projections (medium variant).
  • Questions or suggestions? Please email [email protected].

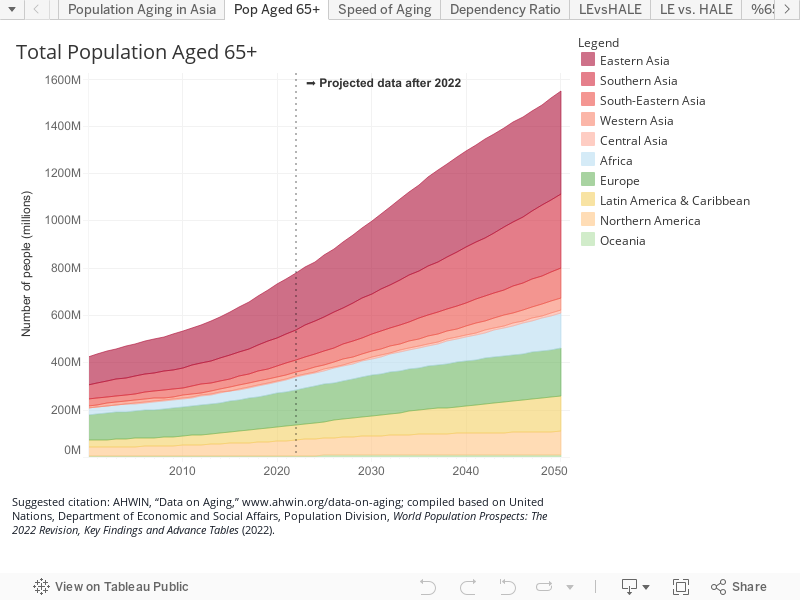
But the increase in terms of numbers will be enormous. East and Southeast Asia alone are expected to have 572.5 million seniors aged 65 or over by 2050—that is more than double today’s number.

  • Click on a line or an entry in the legend to isolate a single region. Click anywhere on the background of the graph to return to the original view.
  • You may share or download individual data visualizations by using the share icon at the bottom of each map or chart.
  • In all UN data on this site, values for 1950–2022 are estimates and those thereafter are projections (medium variant).
  • Questions or suggestions? Please email [email protected].

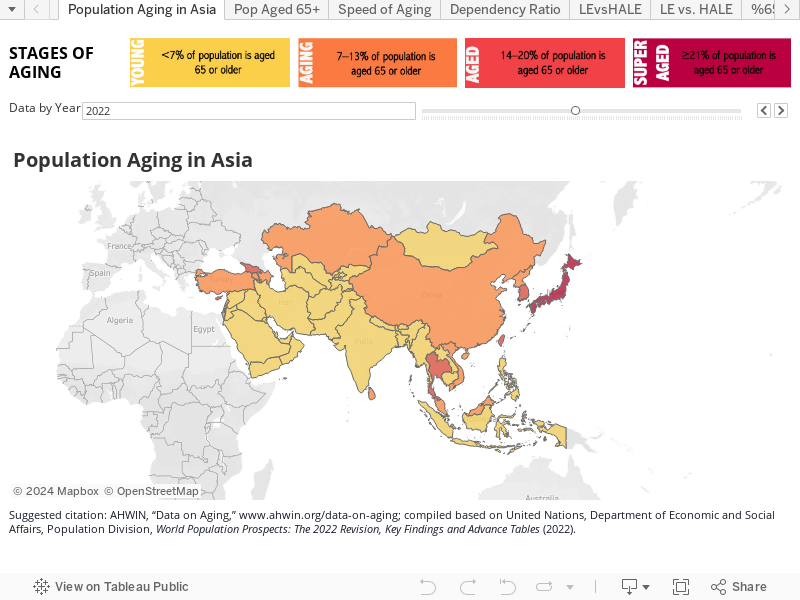
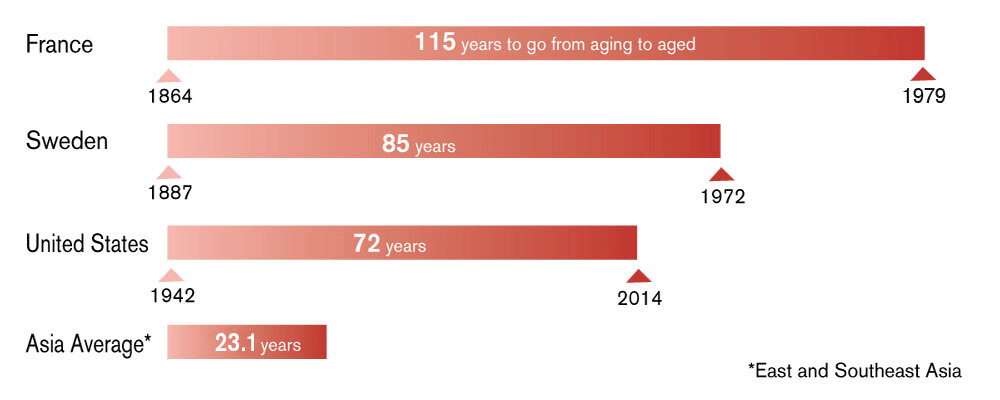
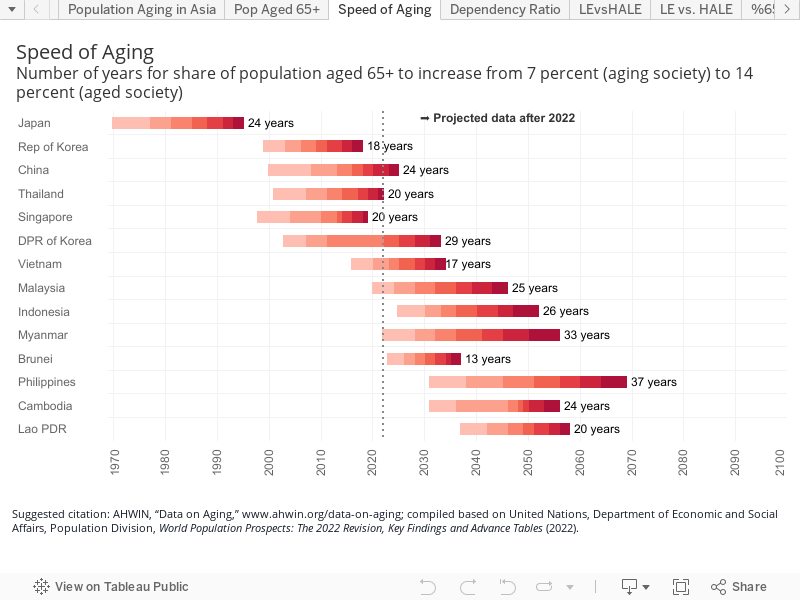
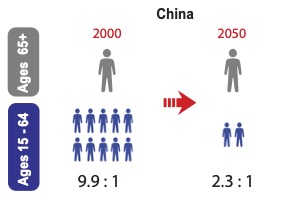
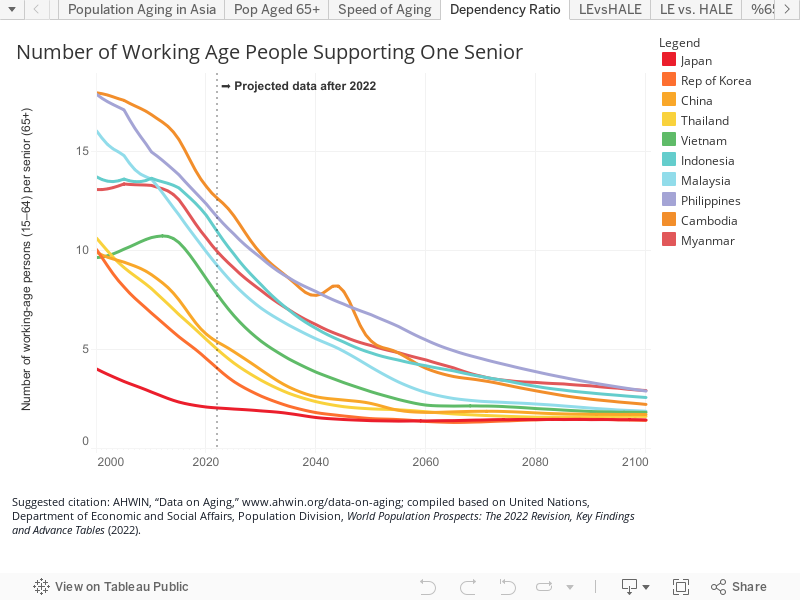
Asian countries are aging at different rates, but some will undergo that change with unprecedented speed

Countries in the West underwent a long, gradual shift from “aging” to “aged” societies, but countries in Asia will make that shift in a fraction of the time.

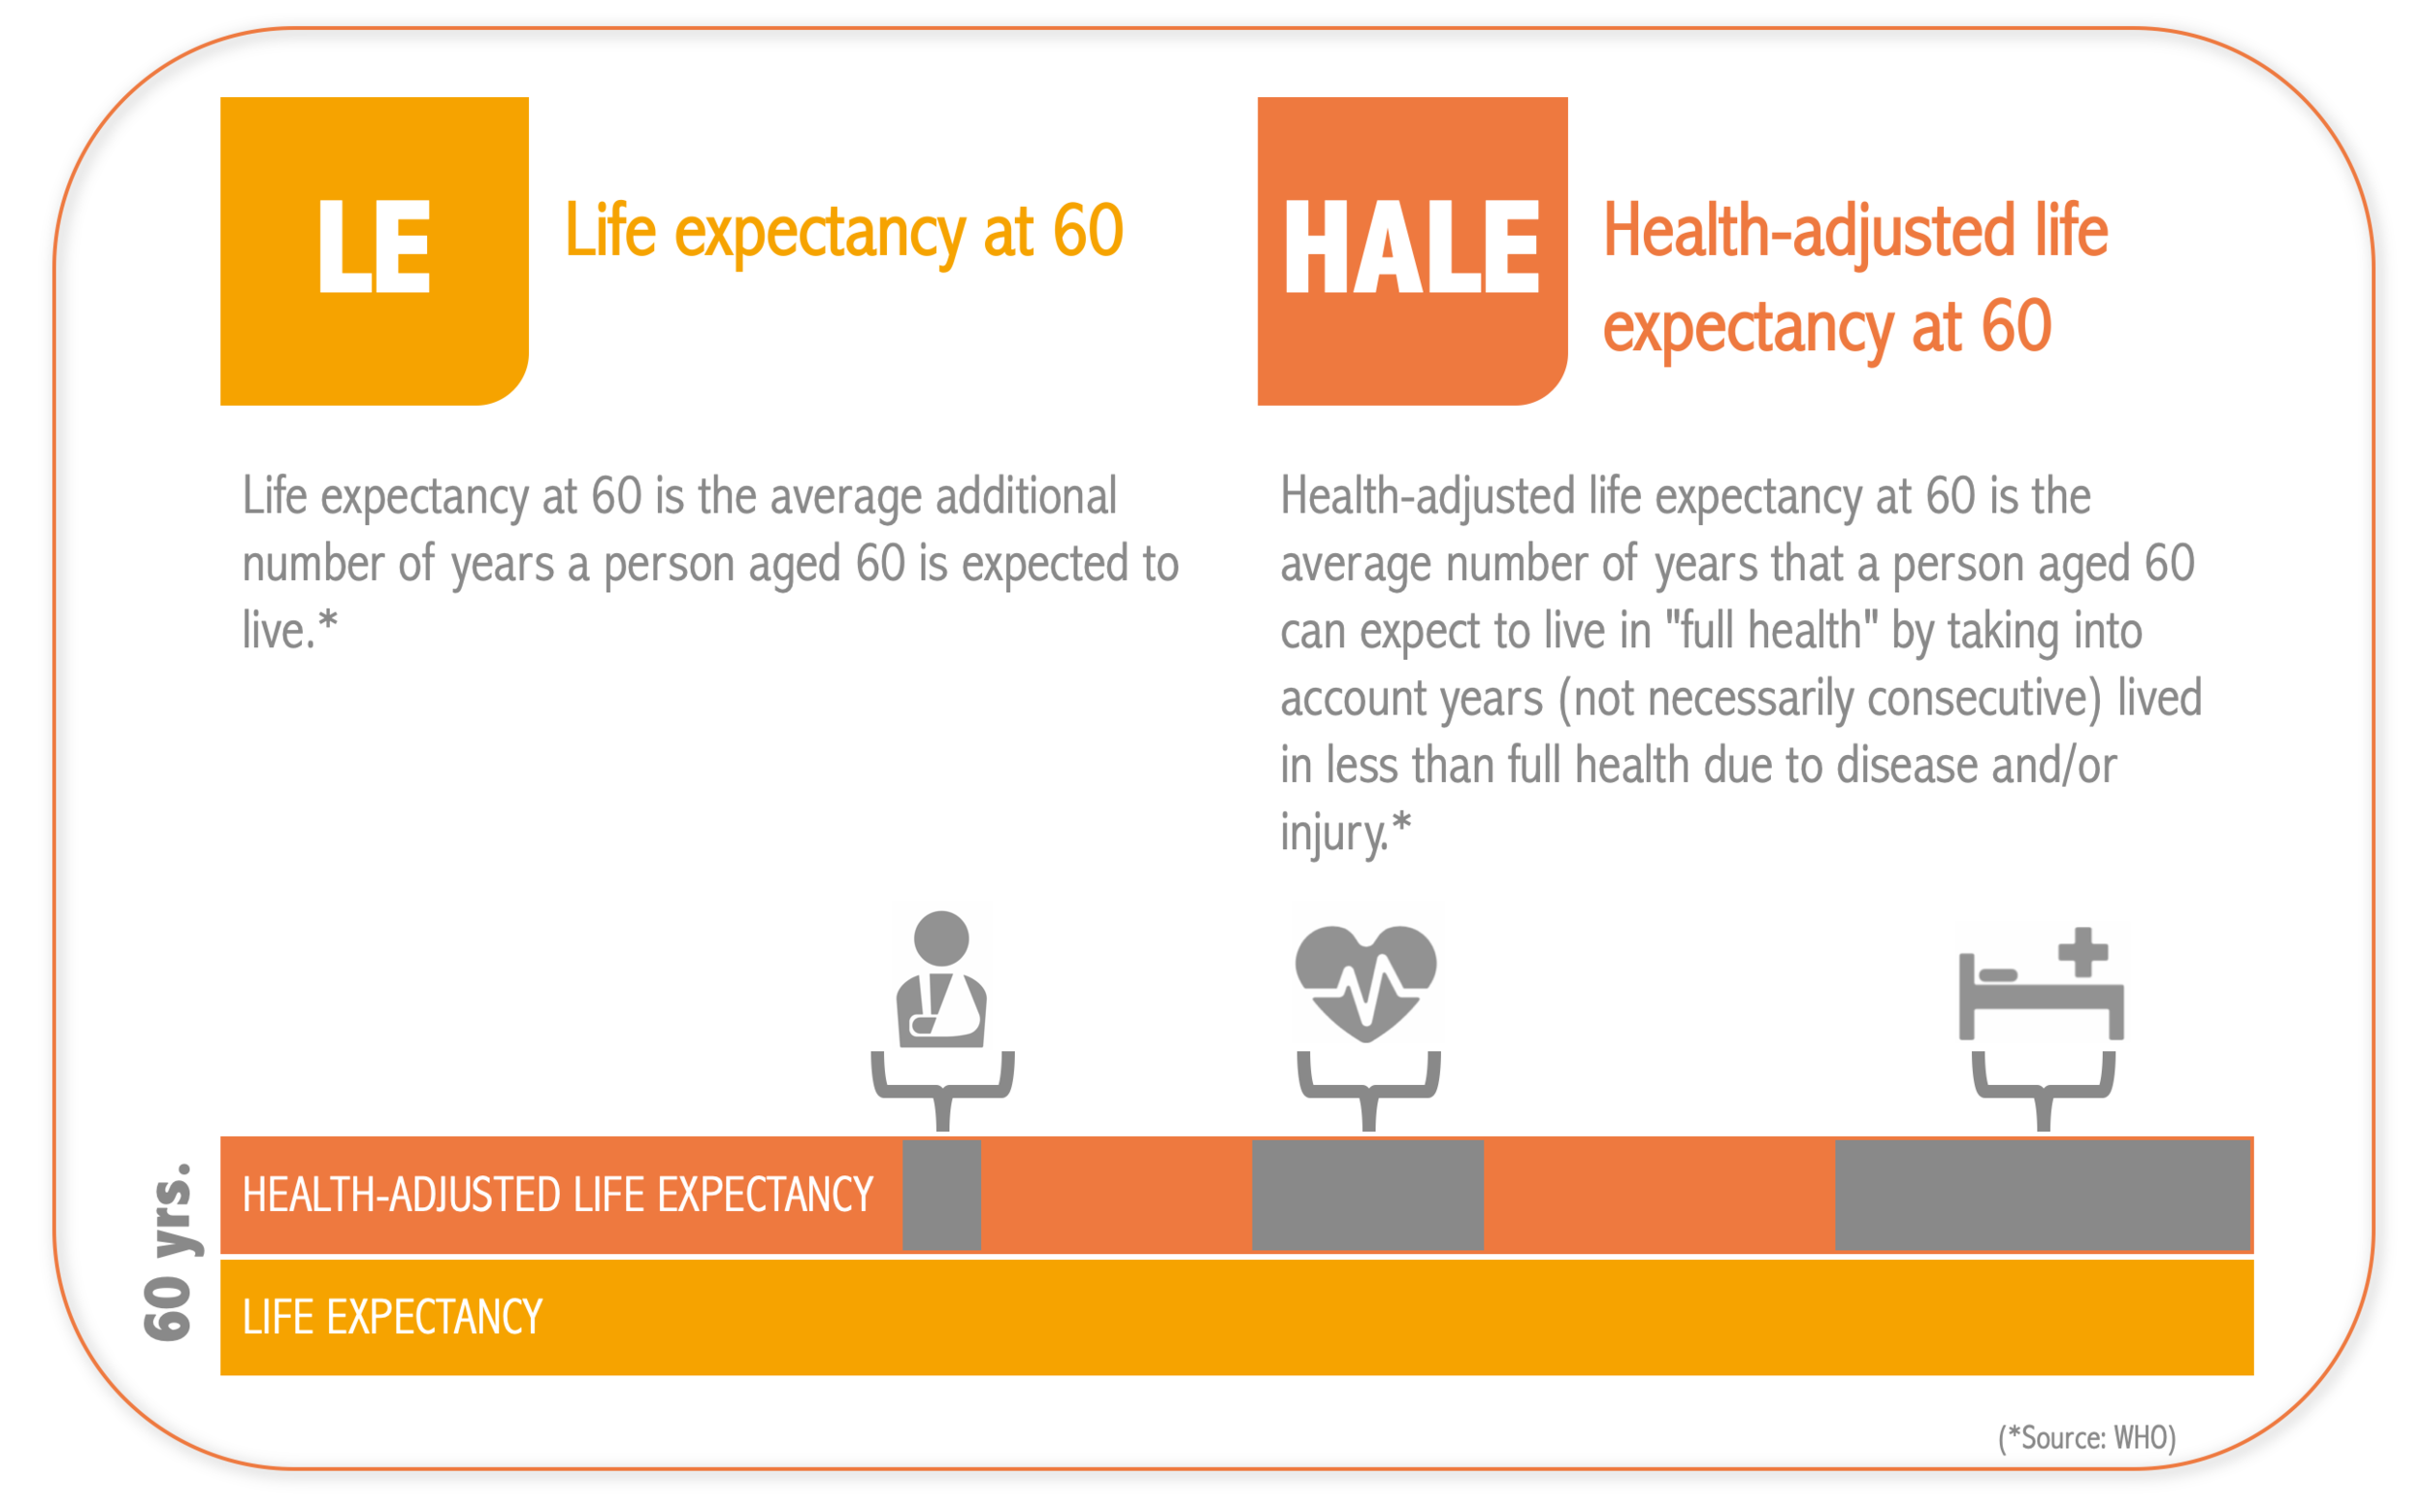
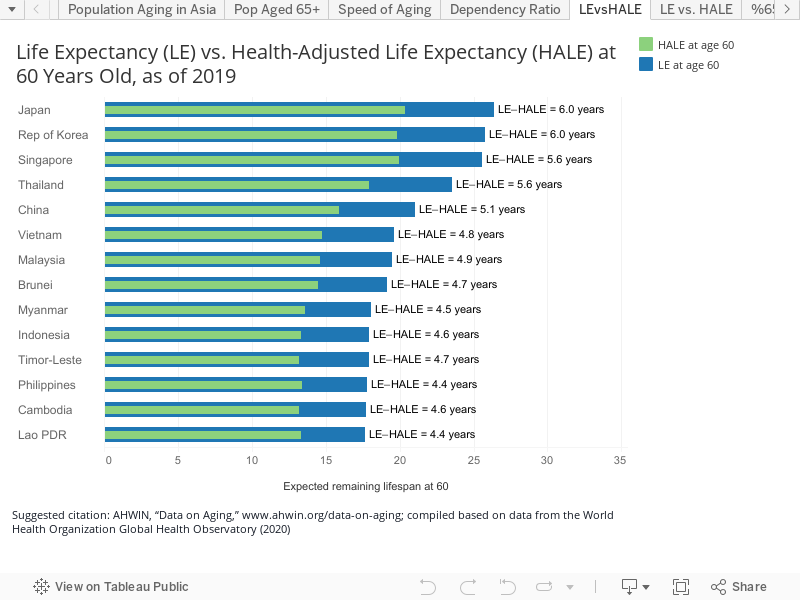
As the senior population grows, so will demand for long-term care and medical treatment

Luckily, life expectancy is rising, but on average, a person over the age of 60 will spend 4–6 years of their remaining life dealing with disabilities.

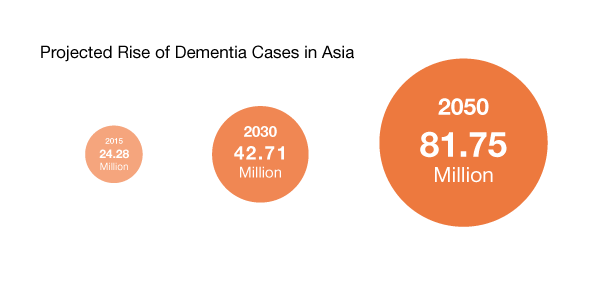
For example, the number of people with dementia in Asia is expected to triple by 2050.

Suggested citation: AHWIN, “Data on Aging,” www.ahwin.org/data-on-aging; compiled based on Alzheimer’s Disease International (2020).

In many Asian countries, there will be fewer working-age people to bear the rising financial and caregiving burdens.

In China, for example, in 2000 there were roughly 10 working-age adults for every 1 senior, but by 2050, that number will drop to just 2.
The chart below shows the changes in this “support ratio” occurring in a number of Asian countries.
  • Click on a line or an entry in the legend to isolate a single region. Click anywhere on the background of the graph to return to the original view.
  • You may share or download individual data visualizations by using the share icon at the bottom of each map or chart.
  • In all UN data on this site, values for 1950–2022 are estimates and those thereafter are projections (medium variant).
  • Questions or suggestions? Please email [email protected].